


Land Change
Oil sands developments can affect aquatic ecosystems directly, through additions or withdrawals of water, and indirectly, through changes to the landscape that affect natural patterns of water movement. Changes to the landscape within drainage basins are used to classify sampling stations as baseline or test.
The extent of land disturbance in each drainage basin is estimated using satellite imagery in conjunction with detailed maps of operations provided by RAMP industry members. As of 2012, approximately 106,100 hectares (3.0%) of land within the RAMP Focus Study Area had been disturbed by RAMP and non-RAMP member companies. The percentage of land disturbed within each basin varies from less than 1% (e.g., the MacKay, Ells, Christina, and Firebag basins) to more than 10% (e.g., Muskeg River, Fort Creek, Shipyard Lake, McLean Creek, and the Tar River). Estimates of land disturbance are used to assess the relevance of observed differences in measurement endpoints between different drainage basins.
Developed areas where there is no natural exchange of water with the rest of the watershed (e.g. tailings ponds) are designated as hydrologically closed-circuited. Developed areas where there is natural exchange of water with the rest of the watershed (e.g. cleared land) are designated as not hydrologically closed-circuited. The land change classification protocol used to classify areas is described in Appendix A of the Annual Technical Reports.
Land change maps
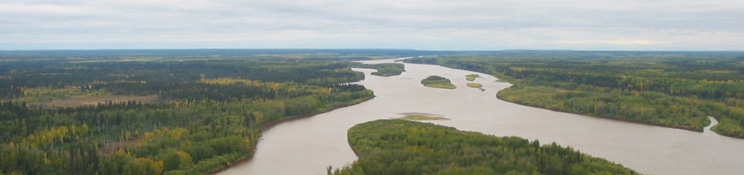
Annual Land Disturbance Maps are included in the online monitoring locations map.
Area of watersheds with land change in 2012
| Watershed | Total Watershed Area (ha) | Watershed Area with Land Change in 2012 (ha) | ||||||
| Focal Projects | Other Oil Sands Projects in RAMP FSA | Total | Watershed Total | |||||
| Not-Closed Circuited | Closed- Circuited | Not-Closed Circuited | Closed- Circuited | Not-Closed Circuited | Closed Circuited | |||
| Minor Athabasca River Tributaries | 160,730 | 7,423 | 30,715 | 7,423 | 30,715 | 38,137 | ||
| Calumet | 17,354 | 130 | 68 | 130 | 68 | 198 | ||
| Christina | 1,303,805 | 6,507 | 785 | 158 | 6,665 | 785 | 7,450 | |
| Ells | 245,000 | 2,273 | 342 | 2,273 | 342 | 2,614 | ||
| Firebag | 568,174 | 3,995 | 1,360 | 3,995 | 1,360 | 5,355 | ||
| Fort Creek | 3,193 | 2,042 | 33 | 2,042 | 33 | 2,075 | ||
| Hangingstone | 106,641 | 9 | 47 | 9 | 47 | 56 | ||
| Horse | 215,741 | 232 | 38 | 163 | 76 | 395 | 114 | 509 |
| MacKay | 557,000 | 3,185 | 619 | 3,185 | 619 | 3,804 | ||
| McLean | 4,712 | 146 | 1,109 | 146 | 1,109 | 1,255 | ||
| Muskeg | 146,000 | 8,854 | 12,619 | 8,854 | 12,619 | 21,473 | ||
| Original Poplar | 13,856 | 182 | 310 | 182 | 310 | 492 | ||
| Steepbank | 135,491 | 4,529 | 488 | 4,529 | 488 | 5,017 | ||
| Tar | 33,261 | 1,248 | 9,576 | 12 | 1,248 | 9,576 | 10,825 | |
| Upper Beaver | 28,711 | 861 | 1,928 | 861 | 1,928 | 2,790 | ||
| FSA Total | 3,544,606 | 41,688 | 64,013 | 322 | 76 | 42,009 | 64,089 | 106,098 |
Table Notes:
- Only land changes within the RAMP FSA were delineated.
- Refers to Athabasca River tributaries from Fort McMurray to the mouth of the Firebag River excluding the watersheds explicitly listed in this table. All land change areas in the minor Athabasca River tributaries in 2012 were upstream of RAMP hydrology station S24.
- Original Poplar refers to the Poplar Creek watershed prior to the Beaver Creek diversion, while "Upper Beaver" refers to that part of the Beaver Creek drainage that now drains into Poplar Creek as a result of the Beaver Creek diversion. Drainage boundaries were estimated from maps provided in Syncrude Canada Ltd. (1977).